Which of the following is the best interpretation of the graph below of mussel size (x-axis) versus energy gain (line graph,left y-axis) ,and number of mussels eaten per day (histogram,right y-axis) ? 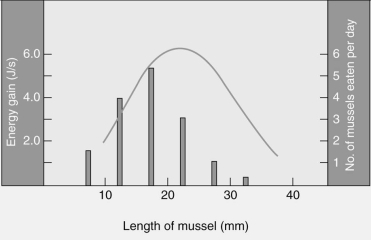
A) Mussels are selected as food sources by crabs.
B) Crabs select mussels in a way that maximizes their energy gain.
C) Mussel size does not seem to be a good predictor as to which mussel hungry crabs will select.
D) Crabs tend to consume most of the largest mussels.
E) Crabs prefer the mussels with the smallest length for their food resources.
Correct Answer:
Verified
Q9: If an unrelated stimulus,such as the ringing
Q15: An animal learns to associate its behavioral
Q23: In an experiment studying predator and prey
Q36: All of the following sources are used
Q38: One type of evolutionary analysis of behavior
Q39: If a scientist is conducting a study
Q43: The area over which an animal moves
Q44: Konrad Lorenz demonstrated that newly hatched birds
Q45: In species where the young are precocial,meaning
Q55: The vertical dive of a moth for
Unlock this Answer For Free Now!
View this answer and more for free by performing one of the following actions

Scan the QR code to install the App and get 2 free unlocks

Unlock quizzes for free by uploading documents