Suppose that a company has X units of resources and is considering three investment/dividend policies,P1,P2 and P.The following graph shows market opportunity lines drawn through each of these points: 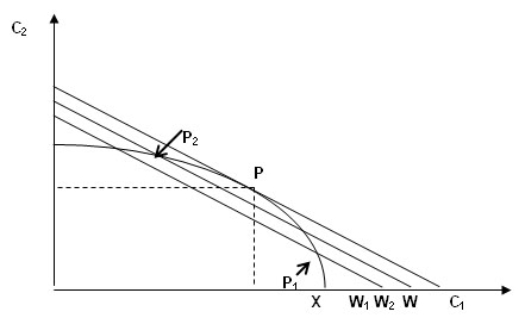
The line through P1 shows that:
A) if policy P1 were adopted,the shareholders' wealth would decrease from W to W1.
B) if policy P1 were adopted,the shareholders' wealth would increase from X to W1.
C) if policy P1 were adopted,the shareholders' wealth would remain unchanged at W1.
D) none of the given options.
Correct Answer:
Verified
Q25: Fama (1970)outlines the sufficient conditions in order
Q26: Consider the following graph. Q27: Consider the following graph: Q28: Consider the following investment/dividend opportunities facing a Q29: Consider the following graph: Q31: Indifference curves are normally: Q32: Consider the following investment/dividend opportunities facing a Q33: Consider the following investment/dividend opportunities facing a Q34: Which of the following correctly represents the Q35: Consider the following investment/dividend opportunities facing a Unlock this Answer For Free Now! View this answer and more for free by performing one of the following actions Scan the QR code to install the App and get 2 free unlocks Unlock quizzes for free by uploading documents![]()
![]()
![]()
A)convex,which means they approach

