Looking at the data in this chart,which observations are correct? 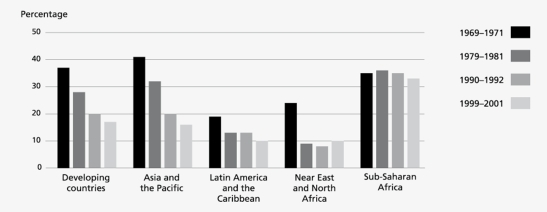
I.The percentage of the population that are undernourished in developing countries has fallen steadily since 1969.
II.The largest decline in undernourished population was in Asia and the Pacific.
III.No region has seen an increase in the undernourished population in any time period after 1969.
A) I and II
B) I and III
C) II and III
D) I,II,and III
Correct Answer:
Verified
Q21: Valine and lysine are both amino acids.Structurally
Q30: All of the energy we need to
Q37: Two amino acids combine to form a
Q38: If you are a vegan,you could still
Q39: Which butter substitute has the lowest percentage
Q40: The fat-soluble vitamins,A,D,E,K,are stored in lipid material.Which
Q41: What is meant by the statement sat
Q42: A 20-year old female weighing 60 kg
Q42: The basal metabolism rate (BMR) is
A)the minimum
Q43: Which of the following was not used
Unlock this Answer For Free Now!
View this answer and more for free by performing one of the following actions

Scan the QR code to install the App and get 2 free unlocks

Unlock quizzes for free by uploading documents