The following figure introduces the relationship between industrial production and wholesale price index changes between the years 1929-1935.What is the purpose of the following figure? 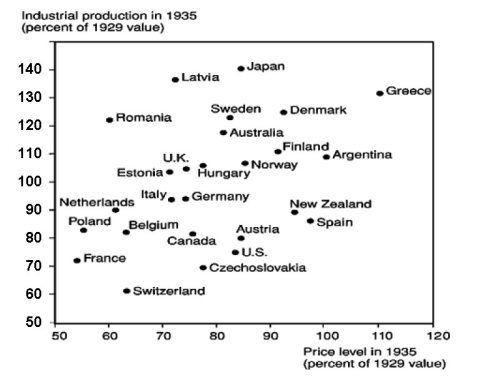
Correct Answer:
Verified
View Answer
Unlock this answer now
Get Access to more Verified Answers free of charge
Q6: The costs of inflation have been most
Q39: The costs of inflation have been most
Q61: Countries with large current account surpluses might
Q63: The current account surplus is
A) an increasing
Q65: Explain how a country with a current
Q66: Discuss the impact of the restoration of
Q70: A person holding dollar deposits during the
Q71: How did the international monetary system influence
Q74: How did the international monetary system created
Q75: What is a convertible currency?
Unlock this Answer For Free Now!
View this answer and more for free by performing one of the following actions

Scan the QR code to install the App and get 2 free unlocks

Unlock quizzes for free by uploading documents