Figure 5-12 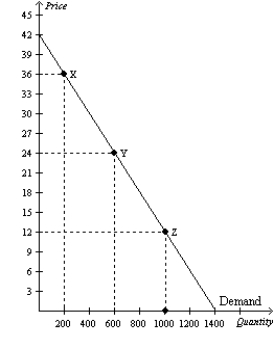
-Refer to Figure 5-12. Using the midpoint method, the price elasticity of demand between point Y and point Z is
A) 0.5.
B) 1.0.
C) 0.75.
D) 1.3.
Correct Answer:
Verified
Q228: Figure 5-12 Q230: Figure 5-13 Q242: For which of the following goods is Q245: Necessities such as food and clothing tend Q246: To determine whether a good is considered Q253: For which of the following goods is Q257: Which of the following should be held Q258: Which of the following should be held Q274: Figure 5-13 Q552: Suppose good X has a positive income Unlock this Answer For Free Now! View this answer and more for free by performing one of the following actions Scan the QR code to install the App and get 2 free unlocks Unlock quizzes for free by uploading documents![]()
![]()
![]()

