Figure 5-13 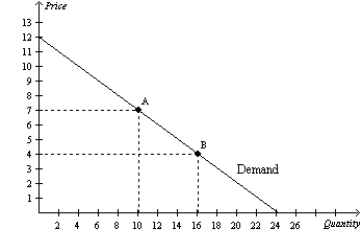
-Refer to Figure 5-13. Between point A and point B on the graph, demand is
A) perfectly elastic.
B) inelastic.
C) unit elastic.
D) elastic, but not perfectly elastid.
Correct Answer:
Verified
Q198: Income elasticity of demand measures how
A)the quantity
Q242: For which of the following goods is
Q244: For which of the following types of
Q246: To determine whether a good is considered
Q253: For which of the following goods is
Q255: For which of the following goods is
Q257: Which of the following should be held
Q258: Which of the following should be held
Q271: Figure 5-12 Q552: Suppose good X has a positive income![]()
Unlock this Answer For Free Now!
View this answer and more for free by performing one of the following actions

Scan the QR code to install the App and get 2 free unlocks

Unlock quizzes for free by uploading documents