This figure reflects the market for outdoor concerts in a public park surrounded by residential neighborhoods.
Figure 10-3 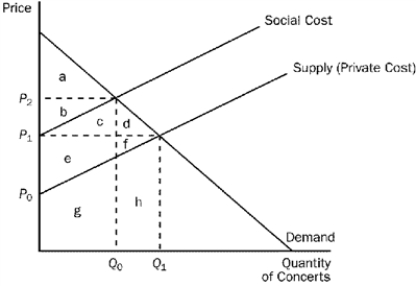
-Refer to Figure 10-3. The social cost curve is above the supply curve because
A) it takes into account the external costs imposed on society by the concert.
B) it takes into account the effect of local noise restrictions on concerts in parks surrounded by residential neighborhoods.
C) concert tickets are likely to cost more than the concert actually costs the organizers.
D) residents in the surrounding neighborhoods get to listen to the concert for free.
Correct Answer:
Verified
Q261: This figure reflects the market for outdoor
Q262: Figure 10-2. The graph depicts the market
Q263: Figure 10-4 Q264: Figure 10-4 Q265: This figure reflects the market for outdoor Q267: Figure 10-2. The graph depicts the market Q268: Figure 10-2. The graph depicts the market Unlock this Answer For Free Now! View this answer and more for free by performing one of the following actions Scan the QR code to install the App and get 2 free unlocks Unlock quizzes for free by uploading documents![]()
![]()

