This figure reflects the market for outdoor concerts in a public park surrounded by residential neighborhoods.
Figure 10-3 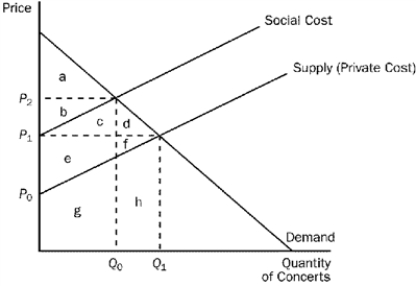
-Refer to Figure 10-3. The difference between the social cost curve and the supply curve reflects the
A) profit margin of each concert.
B) cost of spillover effects from the concert (e.g., noise and traffic) .
C) value of concerts to society as a whole.
D) amount by which the city should subsidize the concert organizers.
Correct Answer:
Verified
Q256: The requirement that a minimum volume of
Q257: At any given quantity, the willingness to
Q258: Figure 10-20. Q259: A rain barrel is a container that Q260: Since air pollution creates a negative externality, Q262: Figure 10-2. The graph depicts the market Unlock this Answer For Free Now! View this answer and more for free by performing one of the following actions Scan the QR code to install the App and get 2 free unlocks Unlock quizzes for free by uploading documents![]()
A)social

