Figure 13-9
The figure below depicts average total cost functions for a firm that produces automobiles. 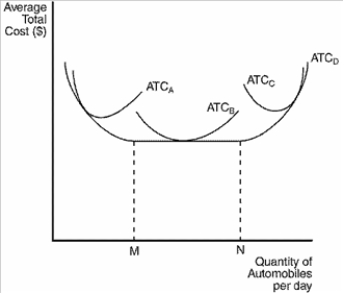
-Refer to Figure 13-9. Which of the curves is most likely to characterize the short-run average total cost curve of the smallest factory?
A) ATCA
B) ATCB
C) ATCC
D) ATCD
Correct Answer:
Verified
Q116: In the long run a company that
Q117: Constant returns to scale occur when the
Q118: Which of the following statements is not
Q125: Suppose that a firm's long-run average total
Q143: Figure 13-9
The figure below depicts average total
Q145: Figure 13-9
The figure below depicts average total
Q150: Table 13-16
Listed in the table are the
Q154: Figure 13-9
The figure below depicts average total
Q257: If a firm experiences constant returns to
Q262: Figure 13-10 ![]()
Unlock this Answer For Free Now!
View this answer and more for free by performing one of the following actions

Scan the QR code to install the App and get 2 free unlocks

Unlock quizzes for free by uploading documents