Figure 18-8
This figure below shows the labor market for automobile workers. The curve labeled S is the labor supply curve, and the curves labeled D1 and D2 are the labor demand curves. On the horizontal axis, L represents the quantity of labor in the market. 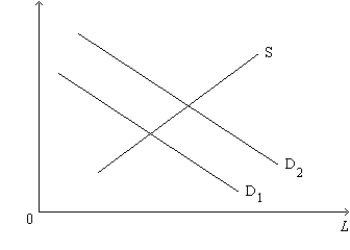
-Refer to Figure 18-8. Which of the following is a possible explanation of the shift of the labor-demand curve from D1 to D2?
A) The wage earned by automobile workers increased.
B) The price of automobiles increased.
C) The opportunity cost of leisure, as perceived by automobile workers, decreased.
D) Large segments of the population changed their tastes regarding leisure versus work.
Correct Answer:
Verified
Q163: Figure 18-8
This figure below shows the labor
Q164: Consider the labor market for short-order cooks.
Q165: Scenario 18-6
Rocchetta Industries manufactures and supplies bottled
Q170: Consider the labor market for short-order cooks.
Q176: Scenario 18-6
Rocchetta Industries manufactures and supplies bottled
Q198: Figure 18-9 Q332: Figure 18-8![]()
This figure below shows the labor

