The following figure introduces the relationship between industrial production and wholesale price index changes between the years 1929-1935. What is the purpose of the following figure? 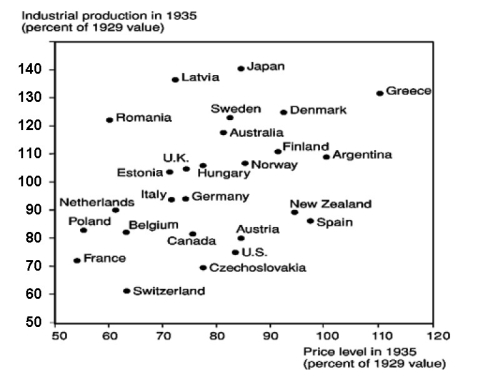
Correct Answer:
Verified
View Answer
Unlock this answer now
Get Access to more Verified Answers free of charge
Q39: The costs of inflation have been most
Q41: What explains the nearly universal scope of
Q43: The price-specie-flow mechanism
A) is an automatic mechanism
Q44: The Great Depression that started in 1929
Q45: A convertible currency is a currency that
Q45: A policy of "beggar-thy-neighbor" is a policy
Q52: It is claimed that L. Frank Baum's
Q54: Describe the effects of the Smoot-Hawley tariff
Q56: The gold standard period was
A) up until
Q60: Under the Gold standard, a country is
Unlock this Answer For Free Now!
View this answer and more for free by performing one of the following actions

Scan the QR code to install the App and get 2 free unlocks

Unlock quizzes for free by uploading documents