A plastics manufacturer performed a quarterly time series analysis for demands over the last five years (periods 1 through 20). The analysis resulted in the following trend equation and seasonal indexes:  = 920.0 + 22.6 t
 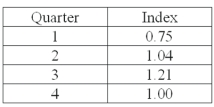 Based on the seasonal indexes, which quarter is expected to have 21% more demand than predicted by the trend line?
Correct Answer:
Verified
Q65: The forecast for the third quarter is
Q78: For the third quarter,the sales are 2,000
Q80: The trend forecast equation is Ŷ =
Q88: The trend forecast equation is Ŷ =
Q98: The Durbin-Watson statistic is used to analyze
A)
Q102: Using the following time series data,
Q103: The table below shows the sales for
Q104: The table below shows the sales for
Q105: Product sales since 1999 are: 
Q106: The table below shows the sales for
Unlock this Answer For Free Now!
View this answer and more for free by performing one of the following actions

Scan the QR code to install the App and get 2 free unlocks

Unlock quizzes for free by uploading documents