Multiple Choice
The following graph is a 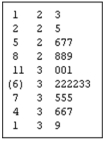
A) Dot plot
B) Stem-and-leaf display
C) Box plot
D) Contingency table
Correct Answer:
Verified
Related Questions
Q1: Quartiles divide a distribution into four equal
Q7: The coefficient of skewness is the standard
Q11: A relationship between two nominal variables is
Q23: A stem-and-leaf display includes the following row:
Unlock this Answer For Free Now!
View this answer and more for free by performing one of the following actions

Scan the QR code to install the App and get 2 free unlocks

Unlock quizzes for free by uploading documents