The following graph is 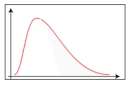
A) Positively skewed.
B) Negatively skewed.
C) Symmetric.
D) Uniformly distributed.
Correct Answer:
Verified
Q25: The interquartile range is graphically presented in
Q41: In a scatter diagram,we describe the relationship
Q48: The following graph is a 
Q49: If the coefficient of skewness is equal
Q50: What does the interquartile range describe?
A) The
Q51: A large oil company is studying the
Q52: Using the following statistics to describe a
Q54: A contingency table would be used to
Q58: What is the possible range of values
Q58: The following graph is a
Unlock this Answer For Free Now!
View this answer and more for free by performing one of the following actions

Scan the QR code to install the App and get 2 free unlocks

Unlock quizzes for free by uploading documents