The demand and supply curves in the market for gasoline are illustrated in the graph below. 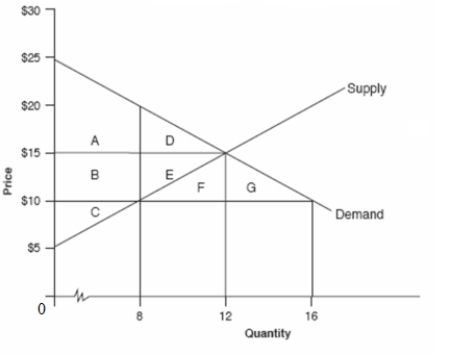 Starting at the equilibrium point,if the government imposes a price ceiling of $10,the deadweight loss will be the area ______.
A) D + E
B) F + G
C) D
D) E
Correct Answer:
Verified
Q36: Which one of the following does not
Q37: Assume Pollutex Inc.produces paper in its plant
Q38: Consumer surplus is
A)the result of a shortage.
B)the
Q39: Assume the market for pencils is competitive
Q40: According to Ronald Coase,for a free-market economy
Q42: Suppose you purchase a bond with a
Q43: Currently XYZ's compensation system is such that
Q44: MACROSOFT's top management is contemplating the development
Q45: Which of the following is a factor
Q46: The demand and supply curves in the
Unlock this Answer For Free Now!
View this answer and more for free by performing one of the following actions

Scan the QR code to install the App and get 2 free unlocks

Unlock quizzes for free by uploading documents