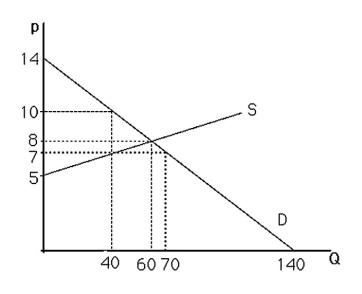
-The above figure shows a graph of the market for pizzas in a large town.At a price of $7,there will be
A) excess demand.
B) excess supply.
C) equilibrium.
D) zero demand.
Correct Answer:
Verified
Q41: If the supply curve of a product
Q42: Q44: The U.S.is planning on imposing quotas on Q45: Restricting imports tends to Q49: Q50: Assume the supply function of ice cream Q54: Once an equilibrium is achieved,it can persist Q58: Technological innovation in the production of computers Q64: If price is initially above the equilibrium Q67: Unlock this Answer For Free Now! View this answer and more for free by performing one of the following actions Scan the QR code to install the App and get 2 free unlocks Unlock quizzes for free by uploading documents![]()
A)shift the demand curve![]()
![]()

