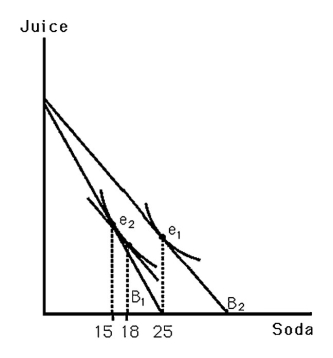
-The above figure shows Bobby's indifference map for soda and juice.B1 indicates his original budget line.B2 indicates his budget line resulting from a decrease in the price of soda.What change in quantity best represents his income effect?
A) 3
B) 10
C) 15
D) 7
Correct Answer:
Verified
Q41: When the price of a good changes,the
Q43: The substitution effect can be measured holding
Q46: In the case of a normal good,
A)
Q51: One characteristic of a Giffen good is
Q52: Suppose that frozen dinners were once a
Q58: Median household income is $50,000 per year.The
Q60: There are only two goods for John
Q61: To separate the income and substitute effects,the
Q66: Q70: ![]()
![]()
Unlock this Answer For Free Now!
View this answer and more for free by performing one of the following actions

Scan the QR code to install the App and get 2 free unlocks

Unlock quizzes for free by uploading documents