Multiple Choice
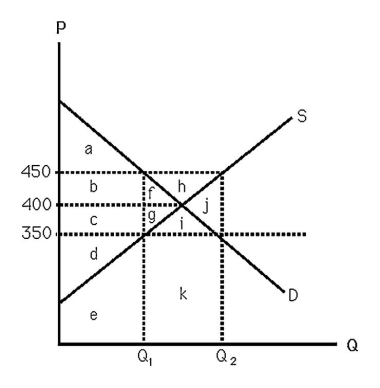
-The above figure shows supply and demand curves for apartment units in a large city.The area "e" represents
A) the loss in producer surplus if a rent ceiling of $350 is imposed.
B) the total variable cost of supplying Q1 units.
C) the marginal cost of supplying Q1 units.
D) the total revenue received by supplying Q1 units.
Correct Answer:
Verified
Related Questions

