Multiple Choice
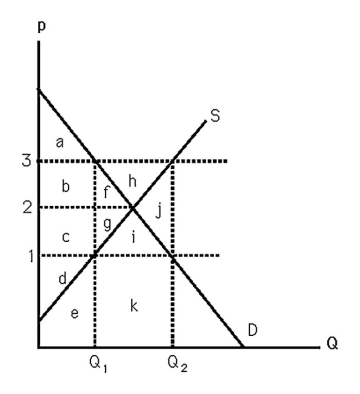
-The above figure shows supply and demand curves for milk.If amount Q2 is produced in the market,
A) producer surplus is maximized.
B) consumer surplus is minimized.
C) a deadweight loss is generated.
D) All of the above.
Correct Answer:
Verified
Related Questions

