Multiple Choice
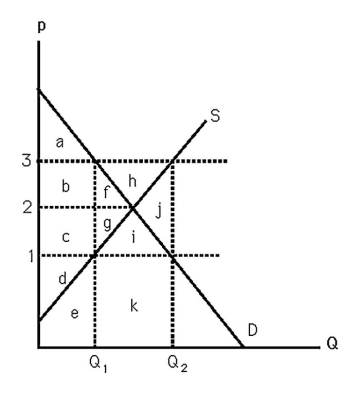
-The above figure shows supply and demand curves for milk.If the government passes a $2 per gallon specific tax,the loss in producer surplus will equal
A) b + c + f + g.
B) f + g.
C) b + f.
D) c + g.
Correct Answer:
Verified
Related Questions

