Consider the following graph: 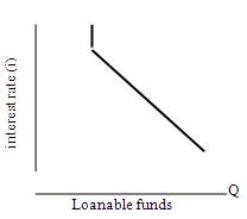 Using the loanable funds approach to interest rate determination,what does the curve in the above graph represent?
A) Household sector supply of loanable funds
B) Business sector demand for loanable funds
C) Overseas sector and household sector supply of loanable funds
D) Government sector and business sector demand for loanable funds
Correct Answer:
Verified
Q23: If there is an excess demand for
Q24: Interest rates will fall when the demand
Q25: All else being equal,the demand curve for
Q26: Under the loanable funds approach to explaining
Q27: Which of the following determine(s)the level of
Q29: The term 'loanable funds' refers to:
A) only
Q30: It is argued that one of the
Q31: In the loanable funds approach to interest
Q32: If there is an excess supply of
Q33: If inflation is expected to increase,this may
Unlock this Answer For Free Now!
View this answer and more for free by performing one of the following actions

Scan the QR code to install the App and get 2 free unlocks

Unlock quizzes for free by uploading documents