Multiple Choice
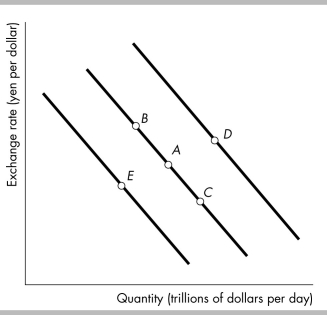
-The above figure shows the demand curve for dollars in the yen/dollar exchange market. A movement from point A to point B means that the
A) quantity supplied of dollars has increased.
B) quantity demanded of dollars has increased.
C) quantity demanded of dollars has decreased.
D) quantity demanded of yen has decreased.
Correct Answer:
Verified
Related Questions

