Multiple Choice
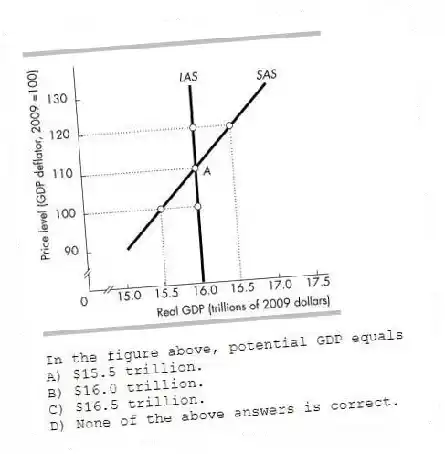
-In the figure above, potential GDP equals
A) $15.5 trillion.
B) $16.0 trillion.
C) $16.5 trillion.
D) None of the above answers is correct.
Correct Answer:
Verified
Related Questions
Q28: The short-run aggregate supply curve
A) shows what
Q33: In the short-run
A) the aggregate supply curve
Q40: Moving along the short-run aggregate supply curve,
A)
Q46: Which of the following statements regarding aggregate
Unlock this Answer For Free Now!
View this answer and more for free by performing one of the following actions

Scan the QR code to install the App and get 2 free unlocks

Unlock quizzes for free by uploading documents