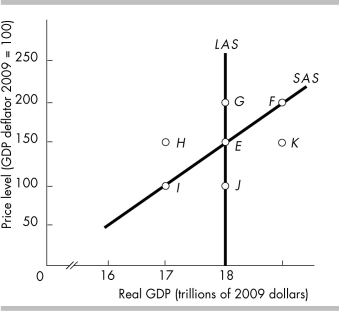
-In the above figure, which movement illustrates the impact of a falling price level and a constant money wage rate?
A) E to I
B) E to F
C) E to J
D) E to H
Correct Answer:
Verified
Q52: The short-run aggregate supply curve shifts when
I.
Q53: Q54: For movements along the short-run aggregate supply Q55: Suppose the price level, the money wage, Q56: The SAS curve and the LAS curve Q58: Which of the following occurs while moving Q59: Which of the following does NOT shift Q60: Moving along a short-run aggregate supply curve, Q61: All of the following shift the short-run Q62: Suppose there is a temporary increase in![]()
A)
Unlock this Answer For Free Now!
View this answer and more for free by performing one of the following actions

Scan the QR code to install the App and get 2 free unlocks

Unlock quizzes for free by uploading documents