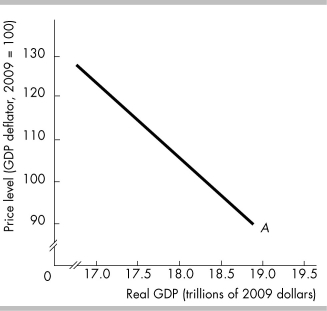
-The curve labeled A in the above figure is
A) a short-run aggregate supply curve.
B) an aggregate demand curve.
C) a long-run aggregate supply curve.
D) a production possibilities curve.
Correct Answer:
Verified
Q212: At long-run macroeconomic equilibrium,
A) an inflationary gap
Q213: Q214: A short-run macroeconomic equilibrium occurs Q215: The AS/AD model studies the relationship between Q216: In the short run, the equilibrium level Q218: Last year in the country of Union, Q219: The economy is in its short run Q220: In the short-run macroeconomic equilibrium Q221: Q222: Unlock this Answer For Free Now! View this answer and more for free by performing one of the following actions Scan the QR code to install the App and get 2 free unlocks Unlock quizzes for free by uploading documents![]()
A) at the
A)
A) real GDP![]()
![]()

