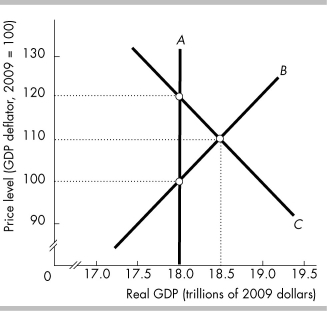
-In the above figure, curve A is the ________ curve, curve B is the ________ curve, and curve C is the ________ curve.
A) long-run aggregate supply; short-run aggregate supply; aggregate demand
B) aggregate demand; short-run aggregate supply; long-run aggregate supply
C) short-run aggregate supply; long-run aggregate supply; aggregate demand
D) long-run aggregate supply; aggregate demand; short-run aggregate supply
Correct Answer:
Verified
Q235: Q236: The data in the above figure indicate Q237: Q238: If aggregate demand grows only slightly faster Q239: Economic growth Q241: A recessionary gap occurs when Q242: If real GDP is less than potential Q243: The Great Depression, in which real GDP Q244: A below-full-employment equilibrium Q245: Suppose the economy is experiencing a recessionary![]()
![]()
A) occurs when the long-run aggregate
A) real GDP
A) is not possible in
Unlock this Answer For Free Now!
View this answer and more for free by performing one of the following actions

Scan the QR code to install the App and get 2 free unlocks

Unlock quizzes for free by uploading documents