Multiple Choice
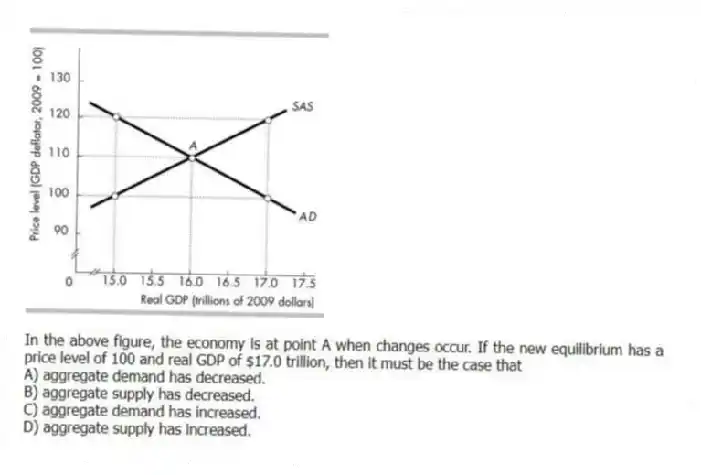
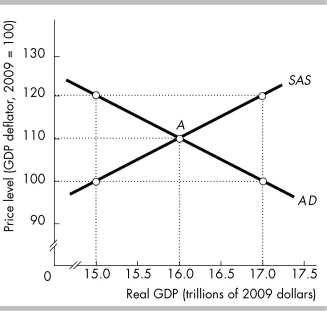
-In the above figure, the economy is at point A when changes occur. If the new equilibrium has a price level of 100 and real GDP of $17.0 trillion, then it must be the case that
A) aggregate demand has decreased.
B) aggregate supply has decreased.
C) aggregate demand has increased.
D) aggregate supply has increased.
Correct Answer:
Verified
Related Questions
Q304: Q326: Q327: Q328: Q328: Assume that the economy is at a Unlock this Answer For Free Now! View this answer and more for free by performing one of the following actions Scan the QR code to install the App and get 2 free unlocks Unlock quizzes for free by uploading documents![]()
![]()
![]()
![]()

