Multiple Choice
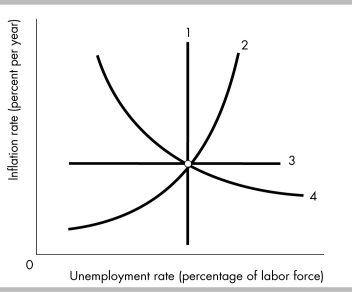
-In the above figure, which of the following curves represents the long-run Phillips curve?
A) 1
B) 2
C) 3
D) 4
Correct Answer:
Verified
Related Questions
Q308: The government estimates that the natural unemployment
Q309: Q310: The short-run Phillips curve and the long-run Q311: An increase in the expected inflation rate Q312: The short-run Phillips curve intersects the long-run Q314: Q315: Q316: If the natural unemployment rate increases, then Q317: A change in the natural unemployment rate Q318: Unlock this Answer For Free Now! View this answer and more for free by performing one of the following actions Scan the QR code to install the App and get 2 free unlocks Unlock quizzes for free by uploading documents![]()
![]()
![]()
A)![]()

