Multiple Choice
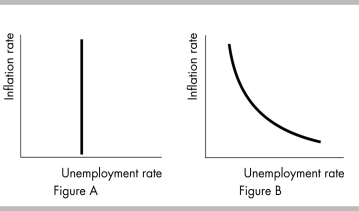
-Which of the diagrams in the above figure best illustrates a short-run Phillips curve?
A) Figure A
B) Figure B
C) both Figure A and Figure B
D) neither Figure A nor Figure B
Correct Answer:
Verified
Related Questions
Q310: The short-run Phillips curve and the long-run
Q311: An increase in the expected inflation rate
Q312: The short-run Phillips curve intersects the long-run
Q313: Q314: Q316: If the natural unemployment rate increases, then Q317: A change in the natural unemployment rate Unlock this Answer For Free Now! View this answer and more for free by performing one of the following actions Scan the QR code to install the App and get 2 free unlocks Unlock quizzes for free by uploading documents![]()
![]()
A)

