FIGURE 2-1 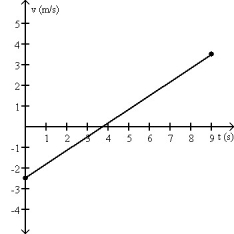
-The motion of a particle is described in the velocity vs. time graph shown in Figure 2-1. We can say that its speed
A) increases.
B) decreases.
C) increases and then decreases.
D) decreases and then increases.
E) remains constant.
Correct Answer:
Verified
Q27: When is the average velocity of an
Q28: At a given instant, the acceleration of
Q29: An object is moving with constant non-zero
Q30: Suppose that a car traveling to the
Q31: An object is moving with constant non-zero
Q33: Suppose that a car traveling to the
Q34: Suppose that an object is moving with
Q35: The area under a curve in a
Q36: If the velocity versus time graph of
Q37: If the position versus time graph of
Unlock this Answer For Free Now!
View this answer and more for free by performing one of the following actions

Scan the QR code to install the App and get 2 free unlocks

Unlock quizzes for free by uploading documents