Short Answer
FIGURE 2-2 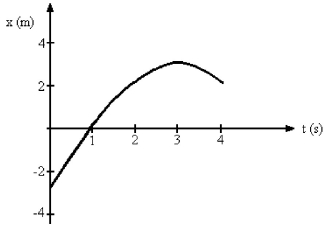
-Figure 2-2 represents the position of a particle as it travels along the x-axis. What is the average speed of the particle between t = 0 s and t = 3 s?
Correct Answer:
Verified
Related Questions
FIGURE 2-2
-Figure 2-2 represents the position of a particle as it travels along the x-axis. What is the average speed of the particle between t = 0 s and t = 3 s?
Correct Answer:
Verified

