FIGURE 30-1 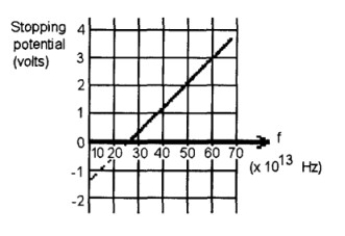
-The graph shown in Figure 30-1 is a plot based on student data from their testing of a
photoelectric material.
(a) Determine the cutoff frequency.
(b) Determine the work function.
Correct Answer:
Verified
View Answer
Unlock this answer now
Get Access to more Verified Answers free of charge
Q53: Through what potential must an electron be
Q54: What primary wavelength and corresponding photon energy
Q55: What is the wavelength of a photon
Q56: A metallic surface has a work function
Q57: A 140. KeV photon strikes an electron
Q59: The human eye can just detect green
Q60: What are the shortest wavelength X-rays produced
Q61: A proton, moving freely, has a wavelength
Q62: What is the energy of a photon
Q63: The surface temperature of the star is
Unlock this Answer For Free Now!
View this answer and more for free by performing one of the following actions

Scan the QR code to install the App and get 2 free unlocks

Unlock quizzes for free by uploading documents