Figure 1 depicts the: 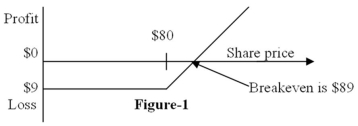
A) position diagram for the buyer of a call option.
B) profit diagram for the buyer of a call option.
C) position diagram for the buyer of a put option.
D) profit diagram for the buyer of a put option.
Correct Answer:
Verified
Q12: The value of a put option at
Q15: The owner of a regular exchange-listed put-option
Q16: Figure 3 depicts the: Q18: Figure 4 depicts the: Q19: Firms regularly use the following to reduce Q21: Which of the following investors would be Q24: Suppose the underlying stock pays a dividend Q32: Buying a call option, investing the present Q36: Suppose you buy a call and lend Q39: If the risk-free interest rate increases, then![]()
![]()
A)call
Unlock this Answer For Free Now!
View this answer and more for free by performing one of the following actions

Scan the QR code to install the App and get 2 free unlocks

Unlock quizzes for free by uploading documents