Figure 6.2 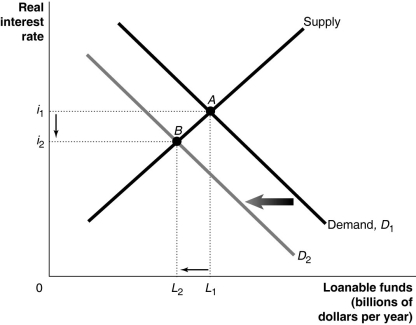 Alt text for Figure 6.2: In figure 6.2, a graph comparing loanable funds and real interest rate.
Long description for Figure 6.2: The x-axis is labelled, loanable funds (billions of dollars per year) , with values L1 and L2 marked.The y-axis is labelled, real interest rate, with values i1 and i2 marked.3 lines are plotted; Demand D1, D2 and Supply.Line D2 begins at the top left corner and slopes down to the bottom centre.Line D1 follows the same slope as D2, but is plotted to the right.The Supply line begins near the origin and slopes up to the top right corner.The area between the lines D1 and D2 is indicated by a right pointing arrow.The Supply line intersects D1 at point A (L1, i1) , approximately 3 quarters of the way along both lines.The Supply line intersects D2 at point B (L2, i2) approximately 3 quarters of the way along both lines.Points A and B are connected to their respective coordinates on the x and y-axis with dotted lines.Between these dotted lines, an arrow points left, from L1 toward L2.and another arrow points down, from i1 toward i2.
-Refer to Figure 6.2.Which of the following is consistent with the graph depicted above?
A) An expected expansion increases the profitability of new investment.
B) The government runs a budget surplus.
C) There is a shift from an income tax to a consumption tax.
D) New government regulations decrease the profitability of new investment.
E) Households save more of their incomes (spend less) .
Correct Answer:
Verified
Q111: Figure 6.5 Q112: Which of the following will increase investment Q113: Borrowers are _ of loanable funds,and lenders Q113: Figure 6.4 Q114: Which of the following would you expect Q117: In comparison to a government that runs Q118: If government saving is negative, then Q119: The response of investment spending to an Q120: If government purchases are $400 million, taxes Q170: Use the equations for public and private![]()
![]()
A)T >
Unlock this Answer For Free Now!
View this answer and more for free by performing one of the following actions

Scan the QR code to install the App and get 2 free unlocks

Unlock quizzes for free by uploading documents