Figure 6.4 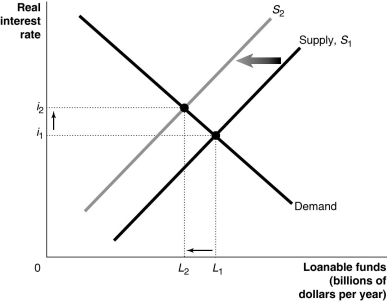 Alt text for Figure 6.4: In figure 6.4, a graph comparing loanable funds and real interest rate.
Long description for Figure 6.4: The x-axis is labelled, loanable funds (billions of dollars per year) , with points L1 and L2 marked.The y-axis is labelled, real interest rate, with points i1 and i2 marked.3 lines are shown; Supply S1, S2 and Demand.The Demand line begins at the top left corner and slopes down to the bottom centre.Line S1 begins near the origin and slopes up to the top right corner.Line S2 follows the same slope as S1, but is plotted to the left.The area between the lines S1 and S2 is indicated by a left pointing arrow.The Demand line intersects line S1 at the point (L1, i1) , a little more than half-way along both the lines.The Demand line intersects line S2 at the point (L2, i2) , a little more than half-way along both the lines.These points of intersection are connected to their respective coordinates on the x and y-axis with dotted lines.Between these dotted lines, an arrow points left from L1 toward L2, and another arrow points up from i1 toward i2.
-Refer to Figure 6.4.Which of the following is consistent with the graph depicted?
A) an increase in household income
B) an increase in transfer payments to households
C) an increase in the proportion of income after net taxes used for consumption
D) an increase in tax revenues collected by the government
E) an increase in the future profitability of firms operations
Correct Answer:
Verified
Q108: If consumers decide to be more frugal
Q109: An increase in the demand for loanable
Q110: There is a government budget surplus if
A)T
Q111: Figure 6.5 Q112: Which of the following will increase investment Q113: Borrowers are _ of loanable funds,and lenders Q114: Which of the following would you expect![]()
Unlock this Answer For Free Now!
View this answer and more for free by performing one of the following actions

Scan the QR code to install the App and get 2 free unlocks

Unlock quizzes for free by uploading documents