Figure 6.5 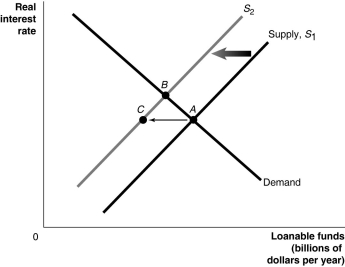 Alt text for Figure 6.5: In figure 6.5, a graph comparing loanable funds and real interest rate.
Long description for Figure 6.5: The x-axis is labelled, loanable funds (billions of dollars per year) , and the y-axis is labelled, real interest rate.3 lines are shown; Supply S1, S2 and Demand.The Demand line begins at the top left corner and slopes down to the bottom centre.Line S1 begins near the origin and slopes up to the top right corner.Line S2 follows the same slope as line S1, but is plotted to the left.The area between lines S1 and S2 is indicated by a left pointing arrow.The Demand line intersects line S1 at point A, a little more than half-way along both lines.The Demand line intersects line S2 at point B, a little more than half-way along both lines.Point C is marked on line S2,such that it is parallel to point A.An arrow points from point A to point C.
-Refer to Figure 6.5."Crowding out" of firm investment as a result of a budget deficit is illustrated by the movement from ________ in the graph above.
A) A to B
B) B to A
C) B to C
D) C to A
E) B to A and then to C.
Correct Answer:
Verified
Q106: Figure 6.3 Q108: If consumers decide to be more frugal Q109: An increase in the demand for loanable Q110: There is a government budget surplus if Q112: Which of the following will increase investment Q113: Figure 6.4 Q113: Borrowers are _ of loanable funds,and lenders Q114: Which of the following would you expect Q116: Figure 6.2 Q118: A government budget surplus from reduced government Unlock this Answer For Free Now! View this answer and more for free by performing one of the following actions Scan the QR code to install the App and get 2 free unlocks Unlock quizzes for free by uploading documents![]()
A)T![]()
![]()

