Starting at point B in the diagram below,identify which combinations of points illustrate technological change.Give a brief explanation to support your answer. 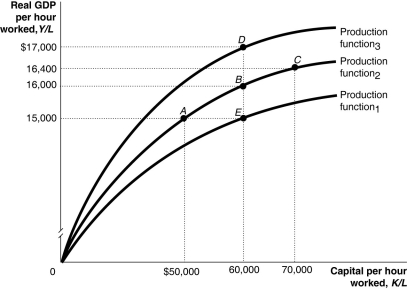 Alt text for Question 46: For question 46,a graph illustrating technological change.
Long description for Question 46: The x-axis is labelled,capital per hour worked,K/L.The y-axis is labelled,real GDP per hour worked,Y/L.3 concave curves originating from 0 at the vertex are shown.5 points,A ($50000,$15000),B ($60000,$16000),C ($70000,$16400),D ($60000,$17000),and E ($60000,$15000)are plotted.The curve labelled Production function 1,passes through point E.The curve labelled Production function 2,passes through points A,B,and C.The curve labeled Production function 3,passes through point D.The 5 points are connected to their respective coordinates on the x and y-axis with dotted lines.
Correct Answer:
Verified
View Answer
Unlock this answer now
Get Access to more Verified Answers free of charge
Q70: Which of the following government provisions would
Q75: Provide examples of three kinds of government
Q81: Creative destruction means that
A)firms develop new products
Q88: The per-worker production function has a _
Q94: An economic growth model
A)explains changes in nominal
Q95: Human capital refers to the percentage of
Q107: The per-worker production function shows the relationship
Unlock this Answer For Free Now!
View this answer and more for free by performing one of the following actions

Scan the QR code to install the App and get 2 free unlocks

Unlock quizzes for free by uploading documents