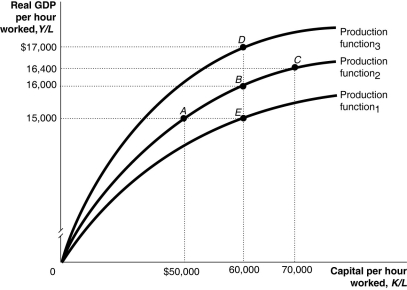
Figure 7.4  Alt text for Figure 7.4: In figure 7.4, a graph representing per-worker production functions.
Long description for Figure 7.4: The x-axis is labelled, capital per hour worked, K/L.The y-axis is labelled, real GDP per hour worked, Y/L.3 concave curves originating from 0 at the vertex are shown.5 points A ($50000, $15000) , B ($60000, $16000) , C ($70000, $16400) , D ($60000, $17000) , and E ($60000, $15000) are plotted.The curve labelled, Production function 1, passes through point E.The curve labelled, Production function 2, passes through points A, B, and C.The curve labelled, Production function 3, passes through point D.These 5 points are connected to their respective coordinates on the x-axis and y-axis with dotted lines.
-Refer to Figure 7.4.Many countries in Africa strongly discouraged and prohibited foreign direct investment in the 1950s and 1960s.By doing so, these countries were essentially preventing a movement from
A) B to A.
B) E to B.
C) A to E.
D) D to B.
E) D to A.
Correct Answer:
Verified
Q130: Figure 7.4 Q131: If the slope of the per-worker production Q132: Figure 7.4 Q133: According to Joseph Schumpeter, which of the Q134: Figure 7.4 Q136: When firms benefit from the results of Q137: According to Joseph Schumpeter which of the Unlock this Answer For Free Now! View this answer and more for free by performing one of the following actions Scan the QR code to install the App and get 2 free unlocks Unlock quizzes for free by uploading documents![]()
![]()
![]()

