Figure 7.5 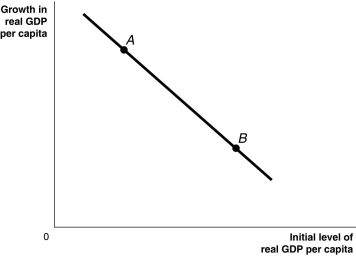 Alt text for Figure 7.5: In figure 7.5, a graph depicting the "catch-up line."
Long description for Figure 7.5: The x-axis is labelled, initial level of real GDP per capita.The y-axis is labelled, growth in real GDP per capita.A line slopes down from the top left corner to the end of the x-axis.2 points, A and B, are plotted on this line such that point A is on the top part of the line, and point B is on the bottom part of the line.
-Refer to Figure 7.5.Based on the "catch-up line" drawn above, poorer countries are more likely to be at a point like ________, where growth in GDP is relatively ________, while richer countries are more likely to be at a point like ________, where growth in GDP is relatively ________.
A) A; low; B; high
B) A; high; B; low
C) B; low; A; high
D) B; high; A; low
E) A; high; B; high
Correct Answer:
Verified
Q160: Growth in real GDP per person in
Q161: Some economists argue that the productivity slowdown
Q162: The rate of growth of productivity in
Q163: Because of the productivity slowdown in Canada
Q164: Describe the pattern of growth rates in
Q166: Compared to the previous 20 years, productivity
Q167: An explanation for the productivity slowdown from
Q168: The economic growth model predicts that
A)the level
Q169: Which of the following is not an
Q170: Which of the following developments have the
Unlock this Answer For Free Now!
View this answer and more for free by performing one of the following actions

Scan the QR code to install the App and get 2 free unlocks

Unlock quizzes for free by uploading documents