Figure 12.3 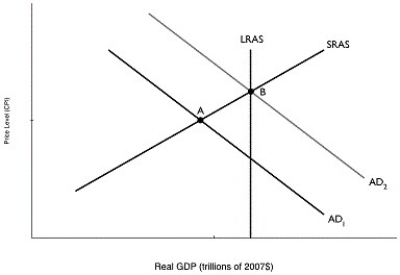 Alt text for Figure 12.3: In figure 12.3, a graph comparing real GDP and price level.
Long description for Figure 12.3: The x-axis is labelled, real GDP (trillions of 2007 dollars) and the y-axis is labelled, price level (CPI) .4 lines are shown; AD1, AD2, LRAS, and SRAS.Line AD1 begins at the top left corner and slopes down to the end of the x-axis.Line AD2 follows the same slope as line AD1, but is plotted to the right.Line SRAS begins close to the vertex and slopes up to the top right corner.Line LRAS is perpendicular to the x-axis and passes through point B.Lines AD1 and SRAS intersect at point A.Lines AD2, LRAS, and SRAS intersect at point B.
-Refer to Figure 12.3.In the graph above, suppose the economy is initially at point A.The movement of the economy to point B as shown in the graph illustrates the effect of which of the following policy actions by the federal government?
A) a decrease in income taxes
B) a decrease in interest rates
C) a decrease in government purchases
D) an increase in the money supply
E) an increase in the number of national statutory holidays
Correct Answer:
Verified
Q42: What is the difference between federal purchases
Q57: Expansionary fiscal policy involves
A)increasing government purchases or
Q58: If the economy is falling below potential
Q60: Figure 12.1 Q61: Tax increases on business income decrease aggregate Q64: Lowering the personal income tax will increase Q65: If the economy is growing beyond potential Q66: Which of the following is considered expansionary Q67: Decreasing government spending _ the price level Q78: Contractionary fiscal policy is used to decrease![]()
Unlock this Answer For Free Now!
View this answer and more for free by performing one of the following actions

Scan the QR code to install the App and get 2 free unlocks

Unlock quizzes for free by uploading documents