Essay
Table 12.6 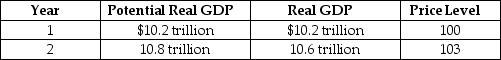
-Refer to Table 12.6.The economy is in the state described by the table above.Draw the dynamic aggregate demand and aggregate supply diagram to illustrate the state of the economy in year 1 and year 2, assuming that no policy is pursued.Then illustrate and explain the appropriate fiscal policy to use in this situation.Assume that the policy results in the economy producing potential GDP.
Correct Answer:
Verified
View Answer
Unlock this answer now
Get Access to more Verified Answers free of charge
Related Questions

