Figure 12.12 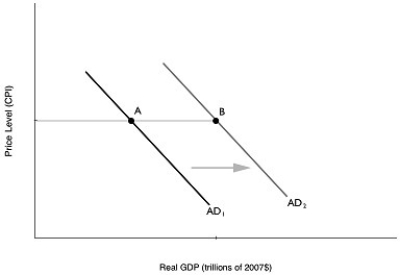 Alt text for Figure 12.12: In figure 12.12, a graph depicting the changes in aggregate demand.
Long description for Figure 12.12: The x-axis is labelled, real GDP (trillions of 2007 dollars) , and the y-axis is labelled, price level (CPI) .2 lines are shown; AD1 and AD2.Line AD1 begins at the top left corner and slopes down to the bottom center.Line AD2 follows the same slope as line AD1, but is plotted to the right.Point A is plotted approximately 3 quarters of the way along line AD1.Point B is plotted less than half way along line AD2.Points A and B are connected to the y-axis with a line, and the area between lines AD1 and AD2 is indicated by a right pointing arrow.
-Refer to Figure 12.12.If government purchases increase by $10 billion and lead to an ultimate increase in aggregate demand as shown in the graph above, the difference in real GDP between point A and point B will be
A) $10 billion.
B) less than $10 billion.
C) more than $10 billion.
D) There is insufficient information given here to draw a conclusion.
Correct Answer:
Verified
Q76: A cut in tax rates affects equilibrium
Q148: The multiplier effect is the series of
Q149: An equal increase in government purchases and
Q150: If the federal government wanted to counteract
Q154: Suppose real GDP is currently $1.25 trillion
Q156: A change in tax rates
A)has a less
Q157: If the absolute value of the tax
Unlock this Answer For Free Now!
View this answer and more for free by performing one of the following actions

Scan the QR code to install the App and get 2 free unlocks

Unlock quizzes for free by uploading documents