Figure 12.13 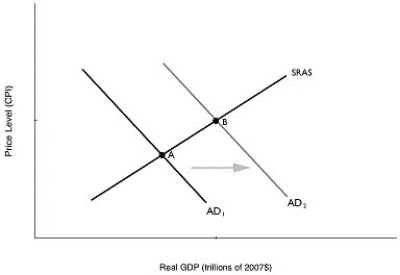 Alt text for Figure 12.13: In figure 12.13, a graph depicting the shift in aggregate demand.
Long description for Figure 12.13: The x-axis is labelled, real GDP (trillions of 2007 dollars) , and the y-axis is labelled, price level (CPI) .3 lines are shown; AD1, AD2, and SRAS.Line AD1 begins at the top left corner and slopes down to the bottom center.Line AD2 follows the same slope as line AD1, but is plotted to the right.The area between lines AD1 and AD2 is indicated by a right pointing arrow.Line SRAS intersects line AD1 at point A, more than half way along line AD1.Line SRAS intersects line AD2 at point B, less than half way along line AD2.
-Refer to Figure 12.13.An increase in government purchases of $20 billion causes aggregate demand to shift ultimately from AD1 to AD2.The difference in real GDP between point A and point B will be ________ $20 billion.
A) equal to
B) less than
C) greater than
D) There is insufficient information given here to draw a conclusion.
Correct Answer:
Verified
Q153: Figure 12.12 Q154: Suppose real GDP is currently $1.25 trillion Q156: A change in tax rates Q157: If the absolute value of the tax Q159: The tax multiplier Q160: Suppose real GDP is $1.7 trillion, potential Q161: The Bank of Canada plays a larger Q162: Suppose that the current equilibrium GDP is Q163: Suppose real GDP is $1.8 trillion and Q164: Why would a higher tax rate lower![]()
A)has a less
A)is negative.
B)is larger in absolute
Unlock this Answer For Free Now!
View this answer and more for free by performing one of the following actions

Scan the QR code to install the App and get 2 free unlocks

Unlock quizzes for free by uploading documents