Figure 13.5 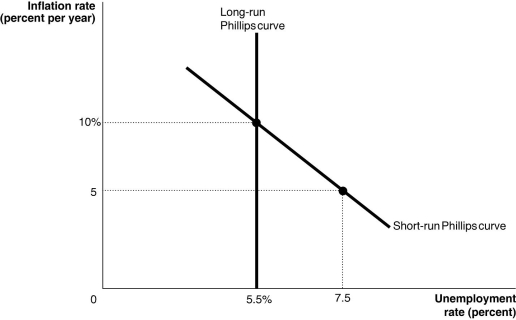 Alt text for Figure 13.5: In figure 13.5, a graph shows the short-run and long-run Phillips curves.
Long description for Figure 13.5: The x-axis is labelled, unemployment rate percent.The y-axis is labelled, inflation rate percent per year.A straight line labelled, short-run Philips Curve, begins at the top left corner and slopes down to the end of the x-axis.A straight line labelled, long-run Philips Curve is perpendicular to the x-axis, and begins from the x-axis value 5.5%.Long-run Philips Curve intersects the short-run Philips Curve at point (5.5%, 10%) .A point (7.5, 5) is plotted near the right end of the short-run Philips Curve.The points are connected to their respective coordinates on the x and y-axes with dotted lines.
-Refer to Figure 13.5.Consider the Phillips curves shown in the above graph.We can conclude from this graph that
A) the natural rate of unemployment in this economy is 5.5 percent.
B) the expected rate of inflation in this economy is 10 percent.
C) ceteris paribus, a fall in the rate of inflation to 5 percent will increase unemployment to 7.5 percent in the short run.
D) All of the above are correct.
Correct Answer:
Verified
Q131: If the Bank of Canada attempts to
Q132: If the economy is producing _, unemployment
Q133: Monetary policy has _ impact on the
Q134: Which of the following would decrease the
Q135: In the short run, the Bank of
Q137: The _ curves are both vertical.
A)aggregate demand
Q138: An increase in expected inflation will
A)increase real
Unlock this Answer For Free Now!
View this answer and more for free by performing one of the following actions

Scan the QR code to install the App and get 2 free unlocks

Unlock quizzes for free by uploading documents