Figure 2-13
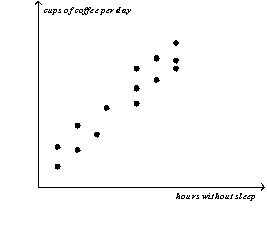
-Refer to Figure 2-13.The graph shown is known as a
A) time-series graph.
B) bar graph.
C) scatterplot.
D) pie chart.
Correct Answer:
Verified
Q2: When two variables have a positive correlation,
A)when
Q11: The second number in any ordered pair
Q14: The first number in any ordered pair
Q24: When two variables have a negative correlation,
A)when
Q25: When two variables have a negative correlation
Q29: When two variables have a negative correlation,
A)they
Q34: When two variables move in the same
Q265: When a relevant variable that is not
Q279: The point where both x and y
Q345: In the ordered pair (17,75),75 is the
A)
Unlock this Answer For Free Now!
View this answer and more for free by performing one of the following actions

Scan the QR code to install the App and get 2 free unlocks

Unlock quizzes for free by uploading documents