Figure 8-19. The figure represents the relationship between the size of a tax and the tax revenue raised by that tax.
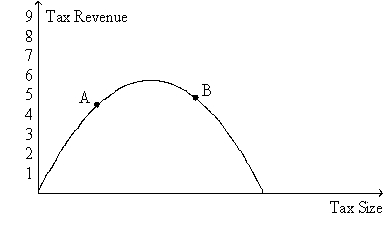
-Refer to Figure 8-19.The curve that is shown on the figure is called the
A) deadweight-loss curve.
B) tax-incidence curve.
C) Laffer curve.
D) Lorenz curve.
Correct Answer:
Verified
Q11: Total surplus is always equal to the
Q41: As the size of a tax rises,the
Q43: When the government imposes taxes on buyers
Q52: If the tax on gasoline increases from
Q345: Figure 8-19. The figure represents the relationship
Q348: Figure 8-19. The figure represents the relationship
Q352: Figure 8-20. The figure represents the relationship
Q353: In a recent research paper published by
Q354: Figure 8-20. The figure represents the relationship
Q355: Figure 8-19. The figure represents the relationship
Unlock this Answer For Free Now!
View this answer and more for free by performing one of the following actions

Scan the QR code to install the App and get 2 free unlocks

Unlock quizzes for free by uploading documents