Figure 8-19. The figure represents the relationship between the size of a tax and the tax revenue raised by that tax.
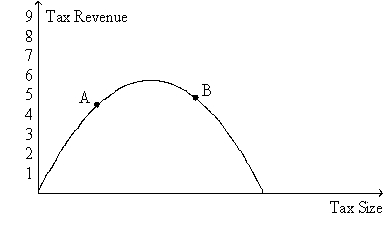
-Refer to Figure 8-19.According to a recent research paper published by the European Central Bank,the U.S.
A) is more likely at a point such as point A rather than point B if the tax in question is the tax on capital income.
B) is more likely at a point such as point B rather than point A if the tax in question is the tax on labor income.
C) could increase tax revenues more by raising taxes on capital income than by raising taxes on labor income.
D) All of the above are correct.
Correct Answer:
Verified
Q2: Taxes are costly to market participants because
Q52: If the tax on gasoline increases from
Q59: Which of the following statements is correct?
A)A
Q201: Suppose the federal government doubles the gasoline
Q350: Figure 8-19. The figure represents the relationship
Q352: Figure 8-20. The figure represents the relationship
Q353: In a recent research paper published by
Q354: Figure 8-20. The figure represents the relationship
Q357: Figure 8-19. The figure represents the relationship
Q358: In a recent research paper published by
Unlock this Answer For Free Now!
View this answer and more for free by performing one of the following actions

Scan the QR code to install the App and get 2 free unlocks

Unlock quizzes for free by uploading documents