Figure 8-20. The figure represents the relationship between the size of a tax and the tax revenue raised by that tax.
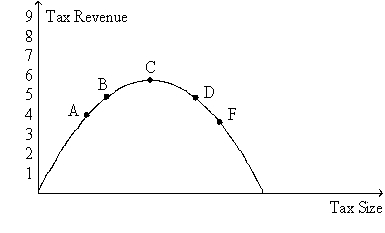
-Refer to Figure 8-20.Suppose the figure pertains to the labor tax,and suppose also that point B represents the position on the curve of the typical European country.Then,according to a recent research paper published by the European Central Bank,the position on the curve of the U.S.would most likely be point
A) A.
B) C.
C) D.
D) F.
Correct Answer:
Verified
Q41: As the size of a tax rises,the
Q43: When the government imposes taxes on buyers
Q52: If the tax on gasoline increases from
Q59: Which of the following statements is correct?
A)A
Q348: Figure 8-19. The figure represents the relationship
Q350: Figure 8-19. The figure represents the relationship
Q353: In a recent research paper published by
Q354: Figure 8-20. The figure represents the relationship
Q355: Figure 8-19. The figure represents the relationship
Q357: Figure 8-19. The figure represents the relationship
Unlock this Answer For Free Now!
View this answer and more for free by performing one of the following actions

Scan the QR code to install the App and get 2 free unlocks

Unlock quizzes for free by uploading documents