Use the following graph shown to fill in the table that follows. 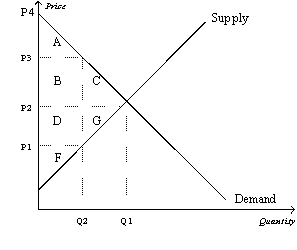

Correct Answer:
Verified
Q41: When the government imposes taxes on buyers
Q42: As the size of a tax increases,
Q44: Economists dismiss the idea that lower tax
Q45: The deadweight loss of a tax rises
Q50: The Laffer curve illustrates how taxes in
Q59: The optimal tax is difficult to determine
Q101: Using demand and supply diagrams, show the
Q113: Suppose that instead of a supply-demand diagram,
Q114: Illustrate on three demand-and-supply graphs how the
Q416: The idea that tax cuts would increase
Unlock this Answer For Free Now!
View this answer and more for free by performing one of the following actions

Scan the QR code to install the App and get 2 free unlocks

Unlock quizzes for free by uploading documents