Figure 10-12 -Refer to Figure 10-12.Suppose,on the Figure,Q Represents the Quantity of the Quantity
Figure 10-12 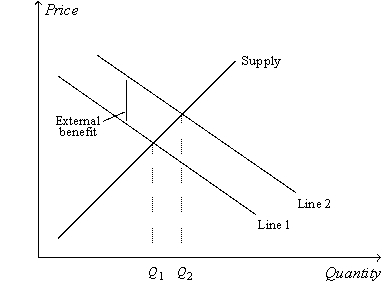
-Refer to Figure 10-12.Suppose,on the figure,Q represents the quantity of education and P represents the price of education.Then the quantity  represents
A) an inefficiency.
B) the extent of the negative externality that pertains to the market for education.
C) the amount of the tax that would be required to correct the negative externality that pertains to the market for education.
D) the amount of the subsidy that would be required to correct the positive externality that pertains to the market for education.
Correct Answer:
Verified
Q122: Figure 10-13. On the graph, Q represents
Q123: Some environmentalists argue that we should protect
Q126: Figure 10-14 Q127: Suppose that an MBA degree creates no Q132: A local manufacturing plant that emitted sulfur Q141: Emission controls on automobiles are an example Q149: Corrective taxes Q212: Which of the following statements is correct? Q223: Corrective taxes differ from most taxes in Q240: If the government were to impose a![]()
A)encourage consumers to avoid sales taxes
A)
Unlock this Answer For Free Now!
View this answer and more for free by performing one of the following actions

Scan the QR code to install the App and get 2 free unlocks

Unlock quizzes for free by uploading documents